Data Scientists
Tether time-series data to geometry—linking sensor streams, system deployments, and geological events to physical forms.
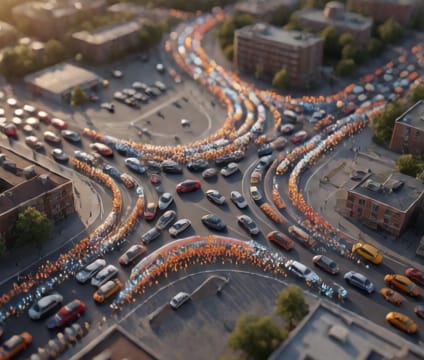
Sensors placed at road junctions can drive real-time traffic flow visualizations by animating throughput, delays, and queue lengths directly onto 3D street geometries. Teams correlate congestion spikes with specific signal timing changes or weather disruptions, revealing cause-effect relationships hidden in flat dashboards.
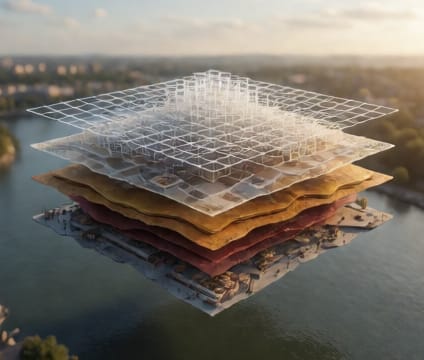
Energy load data from grid-connected buildings can be layered over actual HVAC deployment schedules—both historical and proposed—so teams visualize how thermal demand shifts as infrastructure is upgraded. This helps identify bottlenecks and validate retrofit sequencing without guesswork.
Seismic data points along fault lines can animate projected rupture timelines or past quakes against subsurface models. By anchoring magnitude, depth, and timing to structural geometry, scientists explore how stress transfer might influence nearby fault segments or infrastructure resilience.