Visual progress tracking
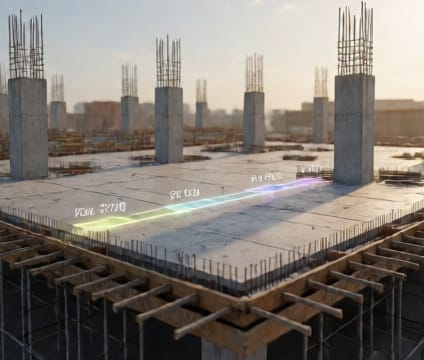
Overlay actual vs planned progress directly on model views to highlight delays, idle zones, or rework hotspots.
4D.io’s progress overlay applies color gradients to model elements based on their scheduled completion status. Elements turning red indicate tasks behind schedule, while gray areas show work not yet started. This visual shorthand helps site supervisors quickly assess field performance during daily stand-ups or weekly reviews.
By comparing multiple schedule versions side-by-side—such as baseline vs current—teams can isolate the geographic impact of slippage. Zones with repeated delays show persistent color shifts, supporting targeted interventions before downstream tasks are affected. Progress bars can be toggled per discipline or contract package.
Progress tracking is dynamic: as progress is updated in the system—via field input or imported data—the 3D scene updates instantly. This avoids version chaos and keeps field and office aligned on what’s been built, what’s pending, and which areas need attention immediately.