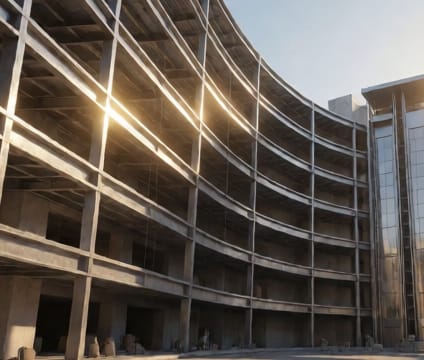
Crew density mapping
Visualize concurrent trades in each zone to prevent workspace overbooking and reduce safety or access conflicts.
Crew density mapping overlays workforce and equipment presence over 3D zones, coloring areas by number of simultaneous occupants and activity types. This reveals zones where too many trades converge, risking bottlenecks or hazardous overlaps. In practice, a mechanical subcontractor installing ductwork alongside electricians and finish carpenters can be flagged before mobilization.
By exporting these density visualizations to VR, you can walk through high-congestion zones with trade leads and safety officers to plan sequencing or staggering. For instance, if structural steel and MEP rough-in occupy the same floor simultaneously, you might push MEP to the next phase or add a third shift—but only if the model shows feasible floor load or egress capacity.
The system calculates density from activity calendars and crew sizes, aggregating by trade or grouping trades as needed. Zones flagged as high density can be color-coded for priority review, helping project managers decide which trades need dedicated access windows. This prevents costly resequencing once field work begins.